Electrify Chicago
According to the
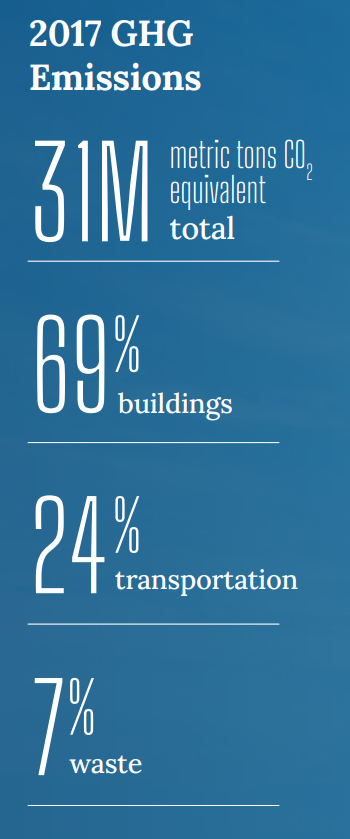
2022 Chicago Climate Action Plan ,
a whopping 69% of Chicago's emissions come from buildings, making it
our biggest challenge and our biggest opportunity as a city to tackle
change. At Electrify Chicago we want to showcase some of the best and worst performing
buildings in the city using publicly available data and manual annotations to add
building photographs and label multi-building owners like universities.
,
a whopping 69% of Chicago's emissions come from buildings, making it
our biggest challenge and our biggest opportunity as a city to tackle
change. At Electrify Chicago we want to showcase some of the best and worst performing
buildings in the city using publicly available data and manual annotations to add
building photographs and label multi-building owners like universities.
You can start by looking at Chicago's buildings with the highest greenhouse gas intensity - this means that they use the most energy when adjusted per unit of square foot, so big buildings could actually perform much better than very inefficient small buildings on this metric.
Chicago Buildings by Greenhouse Gas Intensity
Note: Data only includes large Chicago buildings from 2020
Note: This data only includes buildings whose emissions are reported
under the
Chicago Energy Benchmarking Ordinance. According to the City “As of 2016,
this list includes all commercial, institutional, and residential buildings larger than
50,000 square feet.” This dataset is also then filtered to only buildings with
reported emissions > 1,000 metric tons CO2 equivalent.
This data is also from 2020, but when new benchmark data is available, we'll update the site.
| Property Name / address | Primary Property Type |
Greenhouse Gas Intensity (kg CO2 eq./sqft) |
Total Greenhouse Emissions (metric tons CO2 eq.) |
|---|---|---|---|
|
Adult Rehabilitation Center - Clybourn
2258 N Clybourn Ave
| Residential Care Facility | 7.6 kg/sqft
Highest 33%
| 395 tons
Lowest 18%
|
|
The Tides at Lakeshore East
360 E South Water St
| Multifamily Housing | 7.6 kg/sqft
Highest 33%
| 3,666 tons
Highest 10%
|
|
Erie Centre Condo
375 425 W Erie St
| Multifamily Housing | 7.6 kg/sqft
Highest 33%
| 3,083 tons
Highest 13%
|
|
Prairie House at Central Station
1515 S Prairie Ave
| Multifamily Housing | 7.6 kg/sqft
Highest 33%
| 2,085 tons
Highest 22%
|
|
Chicago Theological Seminary
1407 E 60th St
| College/University | 7.6 kg/sqft
Highest 33%
| 609 tons
Lowest 35%
|
|
1819 S Michigan Avenue Condominium Association
1819 S MICHIGAN AVE
| Multifamily Housing | 7.6 kg/sqft
Highest 33%
| 873 tons
Lowest 50%
|
|
Campbell Terrace
2061 N CAMPBELL AVE
| Multifamily Housing | 7.6 kg/sqft
Highest 33%
| 1,065 tons
Highest 43%
|
|
1240 Lake Shore Drive
1240 N LAKE SHORE DR
| Multifamily Housing | 7.6 kg/sqft
Highest 33%
| 1,145 tons
Highest 40%
|
|
Thorndale Manor Apartments
1020 W THORNDALE AVE
| Multifamily Housing | 7.6 kg/sqft
Highest 33%
| 418 tons
Lowest 20%
|
|
200 N Central
200 N CENTRAL AVE
| Multifamily Housing | 7.6 kg/sqft
Highest 33%
| 380 tons
Lowest 16%
|
|
LondonHouse Chicago
360 N Michigan Ave
| Hotel | 7.6 kg/sqft
Highest 33%
| 2,968 tons
Highest 14%
|
|
The Rookery Building
209 S LaSalle St
| Office | 7.6 kg/sqft
Highest 33%
| 2,558 tons
Highest 16%
|
|
Onni 200 LaSalle
200 N LaSalle Ave
| Office | 7.6 kg/sqft
Highest 33%
| 5,310 tons
Highest 6%
|
|
200 South Wacker Property LLC
200 S Wacker Dr
| Office | 7.6 kg/sqft
Highest 33%
| 6,374 tons
Highest 5%
|
|
111 East Wacker Drive
111 E Wacker Dr
| Office | 7.6 kg/sqft
Highest 33%
| 8,619 tons
Highest 3%
|
Data Source:
Chicago Energy Benchmarking Data