Electrify Chicago
According to the
2022 Chicago Climate Action Plan ,
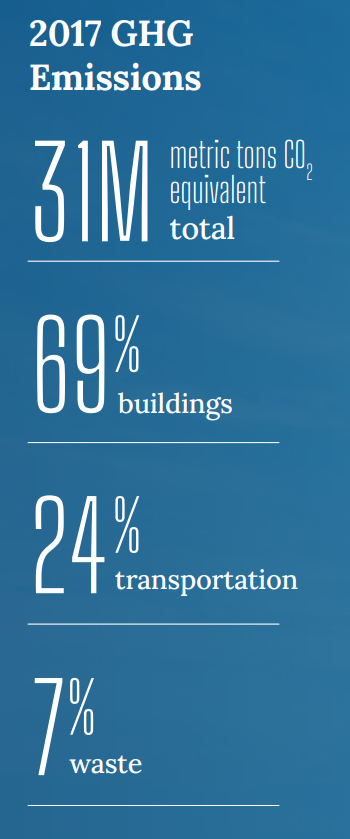
a whopping 69% of Chicago's emissions come from buildings, making it
our biggest challenge and our biggest opportunity as a city to tackle
change. At Electrify Chicago we want to showcase some of the best and worst performing
buildings in the city using publicly available data and manual annotations to add
building photographs and label multi-building owners like universities.
,
a whopping 69% of Chicago's emissions come from buildings, making it
our biggest challenge and our biggest opportunity as a city to tackle
change. At Electrify Chicago we want to showcase some of the best and worst performing
buildings in the city using publicly available data and manual annotations to add
building photographs and label multi-building owners like universities.
You can start by looking at Chicago's buildings with the highest greenhouse gas intensity - this means that they use the most energy when adjusted per unit of square foot, so big buildings could actually perform much better than very inefficient small buildings on this metric.
Chicago Buildings by Greenhouse Gas Intensity
Note: Data only includes large Chicago buildings from 2020
Note: This data only includes buildings whose emissions are reported
under the
Chicago Energy Benchmarking Ordinance. According to the City “As of 2016,
this list includes all commercial, institutional, and residential buildings larger than
50,000 square feet.” This dataset is also then filtered to only buildings with
reported emissions > 1,000 metric tons CO2 equivalent.
This data is also from 2020, but when new benchmark data is available, we'll update the site.
| Property Name / address | Primary Property Type |
Greenhouse Gas Intensity (kg CO2 eq./sqft) |
Total Greenhouse Emissions (metric tons CO2 eq.) |
|---|---|---|---|
|
6 West Hubbard
6 W HUBBARD ST
| Office | 12.8 kg/sqft
Highest 8%
| 844 tons
Lowest 49%
|
|
8501 West Higgins Rd Chicago IL
8501 W Higgins Rd
| Office | 12.8 kg/sqft
Highest 8%
| 2,119 tons
Highest 21%
|
|
Harmony Nursing and Rehabilitation
3919 W FOSTER AVE
| Residential Care Facility | 12.8 kg/sqft
Highest 8%
| 825 tons
Lowest 48%
|
|
Gateway Chicago West
3828 W Taylor St
| Residential Care Facility | 12.7 kg/sqft
Highest 8%
| 654 tons
Lowest 39%
|
|
Wishnick Hall
3255 S Dearborn Street
| College/University | 12.6 kg/sqft
Highest 8%
| 793 tons
Lowest 46%
|
|
Alden Wentworth Rehabilitation & Health Care Center
201 W 69TH ST
| Senior Living Community | 12.6 kg/sqft
Highest 8%
| 1,130 tons
Highest 41%
|
|
CHICAGO
1030 W DIVISION ST
| Wholesale Club/Supercenter | 12.6 kg/sqft
Highest 8%
| 1,900 tons
Highest 24%
|
|
600 West Chicago & 900 N Kingsbury
🚨
600 W Chicago
| Office | 12.6 kg/sqft
Highest 8%
| 27,152 tons #8 Highest
|
|
MARTIN LUTHER KING COMMUNITY CENTER
4314 S Cottage Grove Ave
| Other - Entertainment/Public Assembly | 12.5 kg/sqft
Highest 9%
| 711 tons
Lowest 42%
|
|
909 W. Washington Condo
909 W WASHINGTON BLVD
| Multifamily Housing | 12.5 kg/sqft
Highest 9%
| 1,140 tons
Highest 40%
|
|
Chicago Bar Association
321 S Plymouth Ct
| Office | 12.5 kg/sqft
Highest 9%
| 1,238 tons
Highest 38%
|
|
Southpoint Nursing & Rehabilitation Center
1010 W 95TH ST
| Senior Living Community | 12.5 kg/sqft
Highest 9%
| 1,011 tons
Highest 44%
|
|
Chicago-Central
4058 W Melrose St
| Other - Specialty Hospital | 12.5 kg/sqft
Highest 9%
| 1,489 tons
Highest 32%
|
|
8795
340 E Superior Street
| College/University | 12.4 kg/sqft
Highest 9%
| 2,333 tons
Highest 19%
|
|
Ray and Joan Kroc Corps Community Center
1250 W 119th St
| Fitness Center/Health Club/Gym | 12.4 kg/sqft
Highest 9%
| 1,972 tons
Highest 23%
|
Data Source:
Chicago Energy Benchmarking Data